South Indian Bank Share Price Target 2025, 2026, 2030, 2040, 2050
South Indian Bank was established in 1929 as Kerala’s inaugural private scheduled bank, making it one of the longest-standing private financial institutions. Today, they provide retail and corporate banking, debit cards, financial product distribution, and foreign exchange services.

This blog will discuss its South Indian Bank share price targets as far as 25 years from now (2025 – 2050).
What is South Indian Bank Ltd (NSE: SOUTHBANK)?
South Indian Bank operates 948 branches and 1,315 ATMs in India. Most are situated in semi-urban areas to serve various segments of society with banking needs. South Indian Bank boasts of serving approximately 75 lakh customers for personal and professional needs.
The bank’s loan portfolio is well diversified: corporate loans account for 38%, personal loans 23%, business loans 20% and agricultural loans 19% of the total. Housing loans comprise 29% of individual loans, while gold loans comprise 19%.
Deposits from retail customers make up 64% of the bank’s deposit base, followed by savings deposits (26%), current account deposits (6%) and large deposits (4%) in terms of bank deposits. 36% of its loan portfolio is concentrated in Kerala, while the remaining loans cover South India (34%) and other parts of India (30%).
Fundamental Data Table
| Metric | Value |
|---|---|
| Market Capitalization | ₹ 6,677 Cr. |
| Current Price | ₹ 25.5 |
| High / Low | ₹ 36.9 / 22.3 |
| Stock P/E | 5.51 |
| Book Value | ₹ 33.7 |
| Dividend Yield | 1.18% |
| ROCE | 6.19% |
| ROE | 13.8% |
| Face Value | ₹ 1.00 |
| Industry PE | 11.4 |
| Net CF (PY) | ₹ -4,123 Cr. |
| PBT (Yearly) | ₹ 1,212 Cr. |
| EPS | ₹ 4.63 |
| Promoter Holding | 0.00% |
| PEG Ratio | 0.16 |
| Net Profit | ₹ 1,212 Cr. |
| Debt | ₹ 1,05,832 Cr. |
| Dividend Last Year | ₹ 78.5 Cr. |
| Current Liabilities | ₹ 2,742 Cr. |
| Current Assets | ₹ 14,409 Cr. |
| Debt to Equity | 12.0 |
| Price to Book Value | 0.76 |
| Graham Number | ₹ 59.3 |
Key Financial Metrics
| Metric | Value |
|---|---|
| Revenue | ₹ 9128 Cr. |
| Operating Profit (Yearly) | ₹ 2333 Cr. |
| Compounded Sales Growth (5 Years) | 4.61% |
| Compounded Profit Growth (5 Years) | 34.0% |
| Stock Price CAGR (5 Years) | 22% |
| Return on Equity (ROE) – 5 Years | 9.52% |
| Cash from Operating Activity | ₹ 7075 Cr. |
Peer Comparisons
| S.No. | Name | CMP Rs. | P/E | Market Cap Rs. Cr. | Dividend Yield % | Net Profit (Qtr) Rs. Cr. | Qtr Profit Var % | Sales (Qtr) Rs. Cr. | Qtr Sales Var % | ROCE % |
|---|---|---|---|---|---|---|---|---|---|---|
| 1 | HDFC Bank | 1714.10 | 18.95 | 1311151.07 | 1.14 | 18627.44 | 6.03 | 83001.72 | 10.61 | 7.67 |
| 2 | ICICI Bank | 1280.50 | 19.08 | 903788.99 | 0.78 | 13905.99 | 18.83 | 46325.78 | 18.97 | 7.60 |
| 3 | Kotak Mahindra Bank | 1773.45 | 18.34 | 352671.93 | 0.11 | 5044.05 | 13.07 | 16426.97 | 19.76 | 7.86 |
| 4 | Axis Bank | 1067.60 | 11.82 | 330207.62 | 0.09 | 7435.66 | 19.30 | 31601.05 | 15.26 | 7.06 |
| 5 | IDBI Bank | 75.68 | 12.03 | 81407.26 | 1.98 | 1869.27 | 34.31 | 7445.01 | 23.30 | 6.23 |
| 6 | IndusInd Bank | 983.70 | 9.44 | 76662.97 | 1.68 | 1325.45 | -39.24 | 12686.28 | 12.79 | 7.93 |
| 7 | Yes Bank | 19.04 | 33.26 | 59627.08 | 0.00 | 566.59 | 147.81 | 7737.20 | 15.24 | 5.81 |
| 8 | South Indian Bank | 25.52 | 5.51 | 6676.78 | 1.18 | 324.69 | 18.15 | 2354.72 | 10.60 | 6.19 |
| Period | Share Price (INR) |
|---|---|
| Before 1 Year | ₹24.23 |
| Before 6 Months | ₹26.23 |
| Before 5 Years | ₹9.46 |
| All-Time Max | ₹36.88 |
South Indian Bank shares reflect current market dynamics and investor sentiment. Prices can fluctuate due to economic conditions, company performance and market trends; investors should remain informed and consider this information when buying or selling shares.
Check Live Price here:
South Indian Bank’s share price may change tomorrow depending on market conditions, business performance and other economic considerations. Investor sentiment, Market News and industry trends affect how shares move, so monitoring these areas for potential price variations is wise.
| Price Type | Price Change |
|---|---|
| Maximum | +₹2.10 |
| Minimum | -₹0.45 |
SOUTHBANK Indicator Based Technical Analysis
NOTE!
Signals may differ across timeframes. If you’re planning to purchase SOUTHBANK and keep it for more than one week, it’s suggested that you choose signals from weekly and daily timeframes. For trading in the short term, signals that range from 5 minutes to 1-hour timeframes are better appropriate.
By 2025, South Indian Bank could see its share price reach between Rs18-Rs41 due to improved profitability, asset quality and digital banking expansion. Focusing on SME lending, retail banking growth, cost optimization for steady business expansion, and strong risk management and innovation will play a pivotal role in maintaining this upward momentum.
| Year | Minimum Price (₹) | Maximum Price (₹) | Remarks |
|---|---|---|---|
| 2025 | 18 | 41 | Growth potential with stable outlook. |
| Month | Minimum Price (₹) | Maximum Price (₹) | Remarks |
| January | 18 | 22 | Stable start, gradual growth. |
| February | 19 | 23 | Moderate growth, steady conditions. |
| March | 20 | 25 | Optimistic growth expected. |
| April | 21 | 27 | Gradual rise with market stability. |
| May | 22 | 29 | Steady growth as market stabilizes. |
| June | 23 | 31 | Growth driven by investor confidence. |
| July | 24 | 33 | Positive results boost growth. |
| August | 25 | 35 | Growth continues, steady demand. |
| September | 26 | 37 | Seasonal growth expected. |
| October | 28 | 39 | Positive momentum, strong outlook. |
| November | 30 | 40 | Year-end growth as financials improve. |
| December | 32 | 41 | Solid close with consistent performance. |
South Indian Bank anticipates that by 2026, their share price should reach between Rs34-50 due to increased digital lending, SME financing and rural banking initiatives. They hope sound risk management, increasing CASA deposits, and AI-driven operations could fuel further growth. At the same time, fintech collaborations and operational efficiency will help maintain profitability and reach this price goal.
| Year | Minimum Price (₹) | Maximum Price (₹) |
|---|---|---|
| 2026 | 34 | 50 |
| Month | Minimum Price (₹) | Maximum Price (₹) |
| January | 34 | 37 |
| February | 35 | 38 |
| March | 36 | 40 |
| April | 37 | 41 |
| May | 38 | 42 |
| June | 39 | 43 |
| July | 40 | 45 |
| August | 41 | 47 |
| September | 42 | 48 |
| October | 43 | 49 |
| November | 44 | 50 |
| December | 45 | 50 |
South Indian Bank shares could reach Rs65-Rs95 by 2030 due to aggressive digital transformation initiatives, the expansion of retail lending, and an emphasis on sustainable banking practices. By taking advantage of fintech partnerships and expanding into rural areas, they may increase market share, while AI-powered customer service should facilitate further growth while maintaining operational efficiencies.
| Year | Minimum Price (₹) | Maximum Price (₹) |
|---|---|---|
| 2030 | 65 | 95 |
| Month | Minimum Price (₹) | Maximum Price (₹) |
| January | 65 | 68 |
| February | 67 | 70 |
| March | 68 | 72 |
| April | 69 | 73 |
| May | 71 | 75 |
| June | 72 | 77 |
| July | 74 | 79 |
| August | 75 | 80 |
| September | 76 | 83 |
| October | 77 | 85 |
| November | 80 | 90 |
| December | 82 | 95 |
South Indian Bank could see its share price reach Rs250-Rs300 by 2040 due to the expansion of its digital ecosystem and implementation of AI-powered services. As a leader in sustainable banking, South Indian Bank will benefit from green financing opportunities and global partnerships; its strong balance sheet, improved risk management strategies and diversified revenue streams will help overcome challenges and foster sustained growth.
| Year | Minimum Price (₹) | Maximum Price (₹) |
|---|---|---|
| 2040 | 250 | 300 |
| Month | Minimum Price (₹) | Maximum Price (₹) |
| January | 250 | 255 |
| February | 255 | 260 |
| March | 258 | 265 |
| April | 260 | 270 |
| May | 265 | 275 |
| June | 270 | 280 |
| July | 275 | 285 |
| August | 280 | 290 |
| September | 285 | 295 |
| October | 290 | 295 |
| November | 295 | 300 |
| December | 300 | 305 |
South Indian Bank could reach Rs600-Rs850 by 2050 due to its expansion into global markets, advanced fintech integration, and strong customer base. To maximize profitability, they will focus on artificial intelligence (AI), blockchain technology, sustainable finance solutions, and an adaptive growth strategy while providing cost management services and innovative products that ensure long-term success while safeguarding shareholder value.
| Year | Minimum Price (₹) | Maximum Price (₹) |
|---|---|---|
| 2050 | 600 | 850 |
| Month | Minimum Price (₹) | Maximum Price (₹) |
| January | 600 | 610 |
| February | 610 | 620 |
| March | 615 | 630 |
| April | 620 | 635 |
| May | 630 | 645 |
| June | 635 | 650 |
| July | 645 | 660 |
| August | 650 | 665 |
| September | 660 | 675 |
| October | 670 | 685 |
| November | 680 | 700 |
| December | 700 | 725 |
| Year | Minimum Price (₹) | Maximum Price (₹) |
|---|---|---|
| 2025 | 18 | 41 |
| 2026 | 22 | 55 |
| 2030 | 50 | 95 |
| 2040 | 250 | 300 |
| 2050 | 600 | 850 |
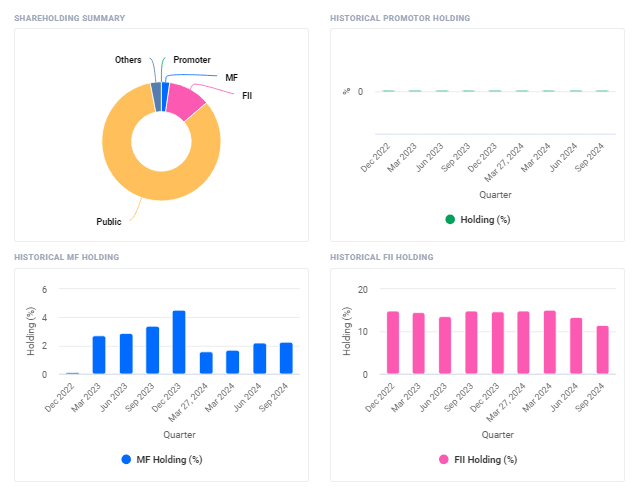
| Shareholding Category | Percentage (as of Sep 2024) |
|---|---|
| FIIs + | 11.47% |
| DIIs + | 5.25% |
| Public + | 83.26% |
| No. of Shareholders | 12,47,471 |
- In the September 2024 quarter, FIIs/FPIs reduced their holdings from 13.44% to 11.47%;
- The number of FII/FPI investors declined from 137 to 135.
- Mutual Funds saw an increase in holdings from 2.19% to 2.28%
- Institutional investors reduced their holdings from 18.54% to 16.724% during the September 2024 quarter.
Should I Buy South Indian Bank Stock?
South Indian Bank achieved an impressive net profit of Rs 325 crore during Q2FY24, an increase of 68% year-on-year thanks to improved asset quality and reduced NPAs. CASA ratio reached 34.51%, reflecting strong deposits, while the P/E ratio at 7.8 suggests potential undervaluation that warrants cautious valuation.
South Indian Bank Ltd Earning Results(Financials)
| Particulars | Sep 2024 | Jun 2024 | Mar 2024 | Dec 2023 | Sep 2023 | Jun 2023 | Mar 2023 |
|---|---|---|---|---|---|---|---|
| Net Profit | ₹325 Cr. | ₹287 Cr. | ₹312 Cr. | ₹298 Cr. | ₹243 Cr. | ₹225 Cr. | ₹210 Cr. |
| Revenue | ₹2,355 Cr. | ₹2,340 Cr. | ₹2,250 Cr. | ₹2,200 Cr. | ₹2,000 Cr. | ₹1,950 Cr. | ₹1,870 Cr. |
| Operating Profit (PBT) | ₹440 Cr. | ₹430 Cr. | ₹420 Cr. | ₹410 Cr. | ₹380 Cr. | ₹365 Cr. | ₹350 Cr. |
| Interest Income | ₹1,472 Cr. | ₹1,460 Cr. | ₹1,450 Cr. | ₹1,420 Cr. | ₹1,400 Cr. | ₹1,390 Cr. | ₹1,380 Cr. |
| Non-Interest Income | ₹452 Cr. | ₹450 Cr. | ₹420 Cr. | ₹420 Cr. | ₹420 Cr. | ₹410 Cr. | ₹390 Cr. |
| Gross NPA | 4.74% | 4.80% | 4.75% | 4.78% | 4.85% | 4.90% | 4.95% |
| Net NPA | 1.61% | 1.58% | 1.60% | 1.59% | 1.62% | 1.65% | 1.67% |
| Capital Adequacy Ratio | 16.04% | 15.80% | 15.90% | 15.70% | 15.60% | 15.50% | 15.40% |
| CASA Ratio | 31.9% | 31.5% | 31.7% | 31.5% | 31.2% | 30.8% | 30.5% |
| Dividend Yield | 1.18% | 1.15% | 1.20% | 1.22% | 1.18% | 1.14% | 1.10% |
| EPS (Earnings per Share) | ₹4.63 | ₹4.47 | ₹4.58 | ₹4.50 | ₹4.20 | ₹4.00 | ₹3.80 |
| Book Value | ₹33.7 | ₹33.2 | ₹33.5 | ₹33.1 | ₹32.8 | ₹32.5 | ₹32.3 |
South Indian Bank recently posted solid quarterly results, with net profit increasing steadily year-on-year to Rs 325 Crore by September 2024 and revenues reaching Rs 2,355 Crore. South Indian Bank boasted high-interest income, improved capital adequacy and stable credit performance as measured by low NPAs/CASA ratios.
Expert Forecasts On The Future Of South Indian Bank Ltd
South Indian Bank appears to have an optimistic future with strong profit growth and improved asset quality, experts note. They point to its growing retail segment, digital transformation initiatives, diversified loan portfolio and emphasis on reducing non-performing asset accounts (NPAs) while increasing CASA deposits to increase capital adequacy and net interest margins, supporting sustainable growth.
Is South Indian Bank Stock to Good Buy? (Bull vs. Bear Case)
Bullish Case Analysis:
- Q2 FY24 net profit rose 68% year on year at Rs325 crore.
- Improvement in Asset quality GNPA was down at 5.18%, from 5.677% the prior quarter.
- A CASA ratio of 34.51% indicates a solid deposit base.
- P/E Ratio of 7.8 Signals Potential Upside Potential.
Bearish Case Analysis:
- High Gross National Product Accounting Averages (GNPA)
- The banking sector faces increasing interest rate pressure.
- The past price volatility could put off risk-averse investors.
- Bigger banks could outstrip growth with strong financials.
CUB Share Price Target 2025, 2026, 2030, 2040, 2050
Conclusion
South Indian Bank shows promise with its strong earnings performance and improving asset quality, making it a wise selection for value investors. However, due to high GNPA levels and industry challenges, it would be prudent for potential investors to exercise caution before making decisions based on risk tolerance and investment objectives. Diversification remains key when creating a balanced portfolio.

