IRB Infra Share Price Target 2025, 2026, 2030, 2040, 2050
IRB Infrastructure Developers Ltd is an infrastructure company in India that specializes in roads and highways. The company was founded in 1998 and is currently one of the largest operators under the Build-Operate-Transfer (BOT) model in the country, with 36 projects. IRB is also active in road maintenance, construction projects, airport development, and real estate investments.
This blog will discuss its IRB Infra share price target as far as 25 years from now (2025 – 2050).
What is IRB Infrastructure Developers Ltd NSE: IRB?
IRB Infra Ltd. currently manages an operational portfolio of more than 12,500 kilometers of roads and several projects under development. The company is active in construction and development (67%). The company is engaged in the BOT/TOT business (32%). It has a strong presence in Maharashtra, Rajasthan, Gujarat, and other states, and it has a large order book and investments in Infrastructure Investment Trusts, enabling it to expand further in India.
Key Financial Metric
| Metric | Value |
|---|---|
| Market Capitalization | ₹36,421 Cr. |
| Current Price | ₹60.3 |
| Stock P/E Ratio | 59.1 |
| Book Value per Share | ₹23.1 |
| Dividend Yield | 0.50% |
| ROCE (Return on Capital Employed) | 8.96% |
| ROE (Return on Equity) | 4.38% |
| Debt | ₹18,838 Cr. |
| Debt-to-Equity Ratio | 1.35 |
| Promoter Holding | 30.4% |
| PEG Ratio | -8.73 |
| EPS (Earnings per Share) | ₹1.02 |
| Dividend (Last Year) | ₹181 Cr. |
| Net Profit | ₹616 Cr. |
| Net Cash Flow (Previous Year) | ₹253 Cr. |
| 52week(High/Low) | ₹ 78.2 / 41.7 |
Fundamental Table
| Fundamental Data | Value |
|---|---|
| Face Value | ₹1.00 |
| Industry P/E Ratio | 25.6 |
| Promoter Holding (Recent) | 30.4% |
| Total Liabilities | ₹44,870 Cr. |
| Total Assets | ₹44,822 Cr. |
| Working Capital Days | 35 Days |
| Cash Conversion Cycle | -306 Days |
| Total Sales (FY 2023) | ₹6,402 Cr. |
| Operating Profit Margin (OPM) | 41% |
| Compounded Sales Growth (5 Years) | 2% |
| Compounded Profit Growth (5 Years) | -7% |
| Stock Price CAGR (5 Years) | 52% |
| Debt-to-Equity Ratio | 1.35 |
| Interest Coverage Ratio | Low |
| EPS Growth (5 Years) | 23% |
| Operating Income (Latest) | ₹722 Cr. |
Peer Comparisons
| S.No. | Company Name | CMP Rs. | P/E | Market Cap (Rs. Cr.) | Net Profit (Rs. Cr.) | Quarterly Profit Growth (%) | Quarterly Sales (Rs. Cr.) | Quarterly Sales Growth (%) | ROCE (%) |
|---|---|---|---|---|---|---|---|---|---|
| 1 | Rail Vikas Nigam | 432.10 | 70.41 | 90,093.72 | 302.51 | -18.26 | 4,869.22 | -0.83 | 18.70 |
| 2 | IRB Infra. Developers Ltd | 60.31 | 59.11 | 36,421.21 | 99.87 | 4.30 | 1,585.84 | -9.12 | 8.96 |
| 3 | Ircon International | 216.60 | 22.11 | 20,371.57 | 205.92 | -17.87 | 2,447.52 | -18.06 | 18.15 |
| 4 | Afcons Infrastructure | 543.25 | 43.62 | 19,979.90 | 135.43 | 30.01 | 2,959.69 | -11.23 | 23.13 |
| 5 | G R Infraprojects | 1,448.70 | 15.23 | 14,014.77 | 193.57 | -16.22 | 1,394.33 | -25.94 | 16.89 |
| 6 | H.G. Infra Engineering | 1,509.85 | 18.78 | 9,839.86 | 80.72 | -16.02 | 902.41 | -5.46 | 24.12 |
| 7 | KNR Constructions | 346.35 | 8.91 | 9,740.56 | 580.02 | 216.20 | 1,944.86 | 87.28 | 25.74 |
The price of IRB Infrastructure Developers Ltd. shares has fluctuated over time. The stock has seen periods of growth, especially during higher infrastructure investment; however, it also has a dip due to economic circumstances. Investors are closely monitoring the stock to see developments in the infrastructure sector.
| Period | Share Price (INR) |
|---|---|
| Before 1 Year | ₹41.70 |
| Before 6 Months | ₹60.00 |
| Before 5 Years | ₹11.50 |
| All-Time Max | ₹78.15 |
IRB Infrastructure Developers Ltd (IRB) shares have recently experienced extraordinary movements in the market. Investors are keeping an eye on the stock for significant fluctuations as it responds to various factors, including changes in infrastructure and market developments. Always verify the current prices via live feeds from the stock market.
Check the Live Price here:
The IRB Infra share price may fluctuate or rise depending on the market and the mood of investors. Positive news could increase prices, like an announcement about new initiatives or a positive quarterly performance. However, adverse market conditions or disappointing reports could result in the cost of the shares sliding.
| Price Type | Change |
|---|---|
| Maximum Target (₹) | ₹6 |
| Minimum Target (₹) | ₹1.5 |
IRB Indicator Based Technical Analysis
NOTE!
Signals may differ across timeframes. If you’re planning to purchase IRB and keep it for more than one week, it’s suggested that you choose signals from weekly and daily timeframes. For trading in the short term, signals that range from 5 minutes to 1-hour timeframes are better appropriate.
IRB share price goal for 2025 is believed to be between Rs 40 and Rs 96 in the region. This price range indicates the expected growth fueled by IRB Infrastructure’s booming road construction and development business. The company’s continuous expansion, robust pipeline of projects, and steady cash flow add to this positive outlook. The future is looking bright as the Indian infrastructure sector expands and offers the possibility of an increase in revenue and a positive impact on the share of IRB’s performance through 2025.
| Year | Minimum Target (₹) | Maximum Target (₹) | Remarks |
|---|---|---|---|
| 2025 | 40 | 96 | Yearly range forecast |
| Month | Minimum Target (₹) | Maximum Target (₹) | Remarks |
|---|---|---|---|
| January | 40 | 65 | Starting at low, moderate growth expected. |
| February | 42 | 67 | Gradual increase, positive market sentiment. |
| March | 44 | 70 | Continued upward trend as market stabilizes. |
| April | 46 | 72 | Small gains, no significant market events. |
| May | 48 | 75 | Slight growth, potential for steady rise. |
| June | 50 | 77 | Market sentiment improving, moderate rise. |
| July | 52 | 80 | Strong growth as demand increases. |
| August | 54 | 82 | Stable growth, possible market correction. |
| September | 56 | 84 | Increasing momentum, favorable news. |
| October | 58 | 85 | Gradual increase, peak approaching. |
| November | 60 | 88 | Strong market performance, rising demand. |
| December | 62 | 96 | Maximum price expected due to year-end rally. |
IRB shares price target for 2026 is anticipated to be between Rs 50 to Rs 105. IRB’s growth is supported by the construction of infrastructure projects and the improvement of roads. As the government’s spending on road infrastructure increases, IRB’s strategic investment will improve earnings and could increase the value of its shares by 2026.
| Year | Minimum Target (₹) | Maximum Target (₹) |
|---|---|---|
| 2026 | 50 | 105 |
| Month | Minimum Target (₹) | Maximum Target (₹) |
|---|---|---|
| January | 50 | 75 |
| February | 52 | 78 |
| March | 54 | 80 |
| April | 56 | 83 |
| May | 58 | 85 |
| June | 60 | 87 |
| July | 62 | 90 |
| August | 64 | 92 |
| September | 66 | 94 |
| October | 68 | 96 |
| November | 70 | 100 |
| December | 72 | 105 |
In 2030, the price of IRB’s shares could be anywhere between Rs 220 to Rs 290. With the ongoing construction of roads and partnerships with private and public sectors, IRB will likely see significant revenue growth. This ongoing focus on sustainability and infrastructure will boost the company’s value. It will benefit investors over the long term.
| Year | Minimum Target (₹) | Maximum Target (₹) |
|---|---|---|
| 2030 | 220 | 290 |
| Month | Minimum Target (₹) | Maximum Target (₹) |
|---|---|---|
| January | 220 | 265 |
| February | 225 | 270 |
| March | 230 | 275 |
| April | 235 | 280 |
| May | 240 | 285 |
| June | 245 | 290 |
| July | 250 | 295 |
| August | 255 | 290 |
| September | 260 | 295 |
| October | 250 | 280 |
| November | 255 | 285 |
| December | 260 | 290 |
By 2040, the IRB’s share price could be between Rs 950 and Rs 1150. As India expands its infrastructure and growing urbanization, IRB’s road projects will boom. Increasing demand for eco-friendly and innovative infrastructure solutions will drive growth and establish IRB as an innovator in the rapidly changing field of transportation.
| Year | Minimum Target (₹) | Maximum Target (₹) |
|---|---|---|
| 2040 | 950 | 1150 |
| Month | Minimum Target (₹) | Maximum Target (₹) |
|---|---|---|
| January | 950 | 1050 |
| February | 955 | 1060 |
| March | 960 | 1070 |
| April | 965 | 1080 |
| May | 970 | 1090 |
| June | 980 | 1100 |
| July | 990 | 1110 |
| August | 995 | 1120 |
| September | 1000 | 1130 |
| October | 985 | 1115 |
| November | 995 | 1125 |
| December | 1000 | 1150 |
In 2050, the IRB’s share price could be anywhere between Rs 3200 to Rs 3800. Thanks to advances in artificial intelligence and intelligent highways, IRB is at the cutting edge of developing the next generation of motorways and sustainable infrastructure. Growing investments in green projects and future-proof transportation systems will boost growth. They will make the IRB an essential actor in India’s development.
| Year | Minimum Target (₹) | Maximum Target (₹) |
|---|---|---|
| 2050 | 3200 | 3800 |
| Month | Minimum Target (₹) | Maximum Target (₹) |
|---|---|---|
| January | 3200 | 3300 |
| February | 3220 | 3350 |
| March | 3240 | 3380 |
| April | 3260 | 3400 |
| May | 3280 | 3420 |
| June | 3300 | 3450 |
| July | 3350 | 3500 |
| August | 3400 | 3550 |
| September | 3450 | 3600 |
| October | 3400 | 3550 |
| November | 3500 | 3700 |
| December | 3550 | 3800 |
| Year | Minimum Target (₹) | Maximum Target (₹) |
|---|---|---|
| 2025 | 40 | 96 |
| 2026 | 50 | 105 |
| 2030 | 220 | 290 |
| 2040 | 950 | 1150 |
| 2050 | 3200 | 3800 |
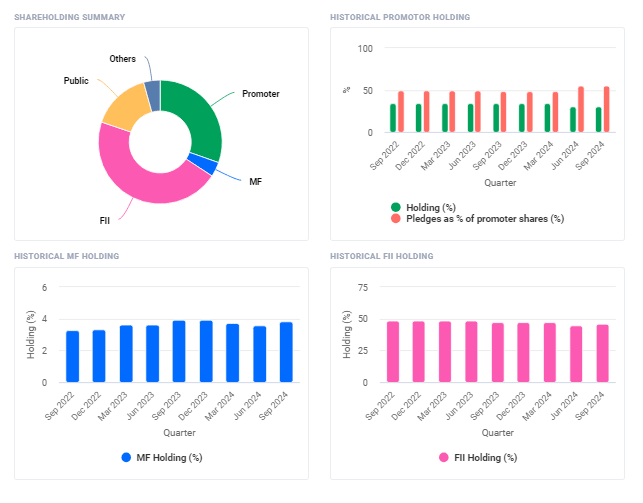
| Particulars | Sep 2024 |
|---|---|
| Promoters + | 30.42% |
| FIIs + | 45.99% |
| DIIs + | 8.10% |
| Government + | 0.01% |
| Public + | 15.49% |
- The promoter’s pledge was unaffected at 55.27 percent of holdings during September 2024.
- The participation of promoters remains the same at 30.42 percent for the September 2024 quarter.
- FII/FPI has increased its share from 44.47 percent to 45.99 percent during the quarter. September 2024.
- The number of investors in FII/FPI was up by 190% to 215 in September 2024’s quarter.
- The mutual funds’ holdings increased by 3.56 percent to 3.84 percent in the September 2024 quarter.
- The amount of MF scheme increased to between 10 and 16 during the September 2024 quarter.
- The share of institutional investors grew from 52.14 percent to 54.11 percent in the Sep 2024 quarter.
Should I Buy IRB Infra Stock?
IRB Infra, a leading supplier of toll road projects across India, offers a lucrative investment opportunity because of its significant involvement in infrastructure and road construction development. With ongoing and forthcoming motorway projects, it is set to profit from government initiatives. However, the market’s conditions and the timeframe for project execution must be considered before deciding to invest.
✔ Tarc Share Price Target 2025, 2026, 2030, 2040, 2050
IRB Infrastructure Developers Ltd Earning Results
| Metric | Sep 2024 | Mar 2024 | Dec 2023 | Sep 2023 | Jun 2023 | Mar 2023 | Dec 2022 | Jun 2022 | Mar 2022 | Dec 2021 | Sep 2021 |
|---|---|---|---|---|---|---|---|---|---|---|---|
| Sales | 1,586 | 2,061 | 1,969 | 1,745 | 1,634 | 1,620 | 1,514 | 1,925 | 1,434 | 1,279 | 1,465 |
| Expenses | 903 | 1,307 | 1,150 | 1,026 | 910 | 898 | 782 | 897 | 852 | 637 | 783 |
| Operating Profit | 683 | 755 | 819 | 719 | 724 | 722 | 732 | 1,027 | 581 | 642 | 682 |
| OPM % | 43% | 37% | 42% | 41% | 44% | 45% | 48% | 53% | 41% | 50% | 47% |
| Other Income | 166 | 443 | 109 | 130 | 111 | 79 | 56 | 71 | 249 | 219 | 39 |
| Interest | 434 | 615 | 433 | 435 | 381 | 373 | 367 | 385 | 399 | 547 | 477 |
| Depreciation | 231 | 274 | 251 | 233 | 237 | 222 | 215 | 203 | 189 | 192 | 165 |
| Profit Before Tax | 183 | 309 | 243 | 182 | 217 | 205 | 206 | 510 | 242 | 121 | 79 |
| Tax % | 46% | 39% | 23% | 47% | 38% | 37% | 31% | 29% | 28% | 40% | 47% |
| Net Profit | 100 | 189 | 187 | 96 | 134 | 130 | 141 | 363 | 174 | 73 | 42 |
| EPS (Rs) | 0.17 | 0.31 | 0.31 | 0.16 | 0.22 | 0.22 | 0.23 | 0.60 | 0.29 | 0.12 | 0.12 |
IRB Infra’s most recent quarterly results demonstrate steady revenue growth that peaked at Rs. 2061 crores by March 2024. Operating margins are healthy, with fluctuation between 37 percent and 53 percent. However, net profits have declined, with the most notable decline occurring during the last few quarters. The cost of interest continues to affect the company’s profitability.
Denta Water & Infra Solutions Share Price Target 2025, 2026, 2030, 2040, 2050
Is IRB Infra Stock to Good Buy? (Bull vs. Bear Case)
Bullish Case:
- The revenue increased from 1,465 crores (September 2021) to 2,061 crores (March 2024).
- Healthy operating margins are about 40-50 percent.
- The strong demand for road construction projects helps long-term growth.
- The expansion of toll projects could increase revenues.
Bearish Case:
- Profit margins fluctuate between 53% and 37%.
- A debt of approximately 1838 crore may restrict a person’s financial flexibility.
- In the long run, high-interest costs affect the company’s profitability.
- Variations in tax rates have affected the growth of earnings.
Conclusion
To summarize, IRB Infra has strong potential for growth due to its growing infrastructure projects and consistent revenues. However, its high debt levels and volatile profit margins are risks. Investors must weigh the long-term potential of road construction projects against risks to their finances, making this stock a good investment for those with a moderate risk tolerance.
Arisinfra Solutions Share Price Target 2025, 2026, 2030, 2040, 2050

