Tesla Stock Price Prediction 2025, 2026, 2030, 2040, 2050
Tesla Inc. is a world leader in electric vehicles and energy solutions. They design, develop and produce electric vehicles and systems for residential, commercial, and industrial customers across North America (the United States and China) and globally; furthermore, they continue to innovate both automotive and energy fields.

This blog will discuss its Tesla Stock Price prediction as far as 25 years from now (2025 – 2050).
What is Tesla Inc NASDAQ: TSLA?
Established in 2003 as Tesla Motors, Inc. and later changed to Tesla Inc. in 2017, Tesla remains at the forefront of innovation for electric vehicles and sustainable energy solutions. Its headquarters can be found in Austin, Texas.
Tesla’s automotive division manufactures electric vehicles, from sedans to SUVs. These are sold through direct sales, used car programs and app-based upgrades; additionally, they come equipped with Supercharger charging stations and warranties and financing/leasing options to ensure a full customer experience.
Tesla Energy Solutions specializes in solar and energy storage products and solutions. Their products include solar panels, storage solutions designed and installed for homes and businesses, and flexible financing plans that offer assurances against energy systems.
Tesla provides customer services such as repairs, upgrades and insurance through its service centers and mobile technicians. Customers can access auto parts, retail items and extended vehicle warranties, expanding Tesla’s ecosystem.
Tesla Inc. Fundamental Data Table
| Attribute | Value |
|---|---|
| Ticker Symbol | NASDAQ: TSLA |
| Industry | Motor Vehicles |
| Market Capitalization | $1,296,350.5 Million |
| Share Price (Latest) | $403.84 |
| 52-Week Price Range | $138.8 – $488.5 |
| Debt-to-Equity Ratio | 0.15 |
| Return on Equity (ROE) | 27.95% |
| Return on Assets (ROA) | 15.9% |
| Mutual Fund Holdings | 42.23% |
| Institutional Holdings | 45.93% |
| Promoter Shareholding | 1.44% |
| Revenue (2023) | $96,773 Million |
| Net Profit (2023) | $14,999 Million |
| Annual Revenue Growth (YoY) | 0.89% |
| Piotroski Score | 4 (Weak Financials) |
Tesla Inc. Key Financial Metrics Table
| Metric | Value | Analysis |
|---|---|---|
| Price-to-Earnings (P/E) Ratio | 102.04 | Higher than sector average (13.87) |
| Price-to-Book (P/B) Ratio | 18.7 | High valuation in the industry |
| TTM Revenue Growth (YoY) | 1.3% | Below industry median |
| Quarterly Revenue (Q3 2024) | $25,182 Million | Positive 7.8% YoY growth |
| Quarterly Net Profit (Q3 2024) | $2,167 Million | Positive 16.9% YoY growth |
| Operating Profit Margin (TTM) | 8.5% | Among the best in the industry |
| Net Profit Margin (TTM) | 17.8% | Healthy profit generation |
| EPS (Latest Quarterly) | $0.6 | Slight decline |
| Interest Coverage Ratio | 64.93 | Excellent ability to cover interest |
| Revenue Forecast (FY 2024) | Expected reduction | EPS estimated to reduce by 51.4% |
Peer Comparisons Table
| Company | Market Cap (USD) | P/E Ratio | Net Profit Margin (TTM) | ROE (%) | Revenue Growth (YoY) |
|---|---|---|---|---|---|
| Tesla Inc. | $1.30 Trillion | 102.04 | 17.8% | 27.95% | 1.3% |
| Ford Motor Co. | $56 Billion | 5.5 | 4.3% | 18.6% | 12.5% |
| General Motors | $48 Billion | 5.9 | 5.6% | 13.5% | 11.3% |
| Rivian Auto. | $20 Billion | N/A | -72.0% | N/A | 65.0% |
| Lucid Motors | $13 Billion | N/A | -200.0% | N/A | 120.0% |
Tesla Stock Price History
| Period | Stock Price (USD) |
|---|---|
| Before 1 Year | $379.05 |
| Before 6 Months | $410.06 |
| Before 5 Years | $88.60 |
| All-Time Max | $479.86 |
Tesla Stock Price Today
Tesla shares have seen an impressive growth rate over the last year, increasing 62.52 per cent throughout its sector. The stock has gained momentum with a remarkable 190.95 per cent gain since its 52-week lows. It is still a popular choice for investors. This is due to solid fundamentals, technological advancement, and its leadership position on the road to electric cars.
Check Live Price Here:
Tesla Stock News
Tesla Stock Price Prediction Tomorrow
The price of Tesla’s stock tomorrow will be influenced by market patterns, developments in the news, and the mood of investors. The increasing demand for electric vehicles worldwide, events worldwide, and earnings announcements can affect the value of the stock. Although predictions differ, Tesla’s EV market dominance ensures it is an investment that many people continue to monitor closely.
| Year | Minimum Target ($) | Maximum Target ($) |
|---|---|---|
| 2024 | -$2.12 | +$5.22 |
TSLA Indicator Based Technical Analysis
NOTE!
Signals may differ across timeframes. If you’re planning to purchase TSLA/USD and keep it for more than one week, it’s suggested that you choose signals from weekly and daily timeframes. For trading in the short term, signals that range from 5 minutes to 1-hour timeframes are better appropriate.
Tesla Stock Price Prediction 2025
Tesla’s share price is predicted to be between $330 and $791 by 2025. The range of prices is driven by Tesla’s steady development of electric cars, its global growth in the market, and technological developments. The market value will likely increase when Tesla launches new vehicles and ramps up production. However, competition, regulation changes, and market volatility can affect the stock’s performance. The company’s solid place within the EV business and technological advancement will help it remain optimistic for 2025.
| Year | Minimum Target ($) | Maximum Target ($) |
|---|---|---|
| 2025 | 330 | 791 |
| Month | Minimum Target ($) | Maximum Target ($) | Remark |
|---|---|---|---|
| January | 330 | 410 | Stable start driven by EV demand. |
| February | 335 | 420 | Slight growth, boosted by optimism. |
| March | 340 | 430 | Continued upward momentum. |
| April | 350 | 440 | Innovations strengthen position. |
| May | 360 | 450 | Positive outlook after Q1 results. |
| June | 370 | 470 | Market confidence improves. |
| July | 380 | 500 | Seasonal peak driven by demand. |
| August | 390 | 520 | Strong performance in global EVs. |
| September | 400 | 550 | Growth fueled by product launches. |
| October | 420 | 600 | Increased investor interest. |
| November | 450 | 700 | Momentum builds after Q3 results. |
| December | 500 | 791 | Year-end rally to new highs. |
Tesla Stock Price Prediction 2026
The Tesla stock price in 2026 is predicted to fall between $400-$900. The forecast reflects Tesla’s growing impact in the energy and electric vehicle industries. Thanks to advances in autonomous driving and new battery technology, Tesla is expected to draw many more investors. It will also fuel growth by entering emerging markets and strategic alliances. The economic climate and competition from other EV producers could affect the top of this model. Its innovative spirit will remain the main factor.
| Year | Minimum Target ($) | Maximum Target ($) |
|---|---|---|
| 2026 | 400 | 900 |
| Month | Minimum Target ($) | Maximum Target ($) |
|---|---|---|
| January | 400 | 500 |
| February | 410 | 520 |
| March | 420 | 540 |
| April | 430 | 560 |
| May | 440 | 580 |
| June | 460 | 600 |
| July | 480 | 630 |
| August | 500 | 650 |
| September | 520 | 680 |
| October | 540 | 720 |
| November | 570 | 800 |
| December | 600 | 900 |
Tesla Stock Price Prediction 2030
Tesla’s stock price for 2030 is expected to be between $1,100 and $800. The projection is a reflection of Tesla’s leading position in the worldwide transition to electric vehicles as well as renewable energy sources. Through 2030, Tesla’s constant advancements in autonomous driving energy storage and production of cars will likely result in a substantial increase. The expansion into new markets, as well as technological advancements in the field of AI, can further enhance its standing. Yet, economic developments in the world and competition pressures could affect the company’s performance in the current timeframe. Tesla’s constant innovation will be an essential aspect.
| Year | Minimum Target ($) | Maximum Target ($) |
|---|---|---|
| 2030 | 800 | 1,100 |
| Month | Minimum Target ($) | Maximum Target ($) |
|---|---|---|
| January | 800 | 900 |
| February | 810 | 920 |
| March | 820 | 940 |
| April | 830 | 960 |
| May | 850 | 980 |
| June | 860 | 1,000 |
| July | 880 | 1,020 |
| August | 890 | 1,040 |
| September | 900 | 1,050 |
| October | 920 | 1,070 |
| November | 940 | 1,090 |
| December | 960 | 1,100 |
Tesla Stock Price Prediction 2040
The price of Tesla’s stock for 2040 is anticipated to be from $1200 to $1400. The dominance of Tesla in electric cars, renewable energy solutions, and autonomous technologies will consolidate its leadership in the market. Tesla’s emphasis on sustainability-based innovations and its growth into new areas, including AI and robotics, will propel expansion. As the demand worldwide for green technologies grows, Tesla will likely profit. However, the dynamics of markets and competition could affect Tesla’s performance within this price range.
| Year | Minimum Target ($) | Maximum Target ($) |
|---|---|---|
| 2040 | 1,200 | 1,400 |
| Month | Minimum Target ($) | Maximum Target ($) |
|---|---|---|
| January | 1,200 | 1,250 |
| February | 1,220 | 1,270 |
| March | 1,240 | 1,290 |
| April | 1,260 | 1,310 |
| May | 1,280 | 1,330 |
| June | 1,300 | 1,350 |
| July | 1,320 | 1,370 |
| August | 1,340 | 1,390 |
| September | 1,360 | 1,400 |
| October | 1,380 | 1,410 |
| November | 1,390 | 1,420 |
| December | 1,400 | 1,430 |
Tesla Stock Price Prediction 2050
The Tesla stock price in 2050 is expected to be between $1,800-$2,000. In 2050, Tesla will likely be the most essential participant in the global community, which includes sustainable technologies, such as batteries for energy storage, smart grid technology, and AI-integrated devices. The company’s continuing expansion into different areas, like transport infrastructure and robotics, will drive the development. Its capacity to expand across various sectors and to innovate with clean energy technology will position the company for a long-term future. However, market dynamics continue to play an essential role in determining its cost.
| Year | Minimum Target ($) | Maximum Target ($) |
|---|---|---|
| 2050 | 1,800 | 2,000 |
| Month | Minimum Target ($) | Maximum Target ($) |
|---|---|---|
| January | 1,800 | 1,850 |
| February | 1,820 | 1,870 |
| March | 1,840 | 1,890 |
| April | 1,860 | 1,920 |
| May | 1,880 | 1,950 |
| June | 1,900 | 1,980 |
| July | 1,920 | 1,990 |
| August | 1,940 | 2,000 |
| September | 1,960 | 2,010 |
Tesla Stock Price forecast
| Year | Minimum Target ($) | Maximum Target ($) |
|---|---|---|
| 2025 | 330 | 791 |
| 2026 | 400 | 900 |
| 2030 | 800 | 1,100 |
| 2040 | 1,200 | 1,400 |
| 2050 | 1,800 | 2,000 |
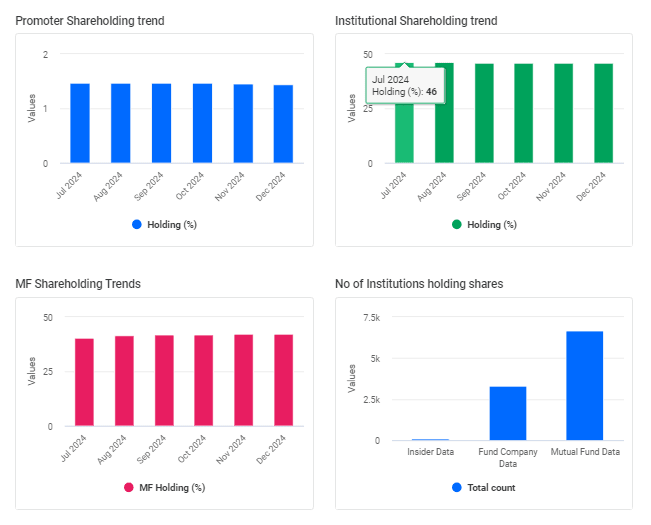
| Holder Type | Stake (%) |
|---|---|
| Insiders | 1.44% |
| Institutional Investors | 45.93% |
| Mutual Funds | 42.23% |
- Insiders’ stakes fell from 1.45% to 1.44% as of Dec 2024.
- Institutional Investors holding remained unchanged at 45.93 per cent in December 2024.
- Mutual Funds holding remains unchanged at 42.23 per cent as of Dec 2024.
Should I Buy Tesla Stock?
Purchasing Tesla stocks is viable if you are confident in an electric future based on cars and renewable energy. Tesla has a strong growth potential due to its innovative approach in the field of technology. Considering the risks of market and competitive pressures before investing is essential. Make sure to conduct thorough research.
Tesla Inc Earning Quarterly Results(USD)
Tesla Inc.’s quarterly earnings report a steady rise in profit and revenue. In September 2024, Tesla announced a profit total of $25.18 billion, up 7.8 per cent over the previous year. Net earnings were $2.17 billion, a 16.9 per cent YoY rise. Operating profits reached $2.77 billion. Even though there was a slight drop in operating revenues compared to the last period, Tesla continues to show solid financial results fueled by effective operations and a buoyant market.
| Indicator | Sep ’24 | Jun ’24 | Mar ’24 | Dec ’23 | Sep ’23 | Jun ’23 | Mar ’23 | Dec ’22 | Sep ’22 | Jun ’22 | Mar ’22 | Dec ’21 | Sep ’21 |
|---|---|---|---|---|---|---|---|---|---|---|---|---|---|
| Operating Revenue (USD Million) | 25,182 | 25,500 | 21,301 | 25,167 | 23,350 | 24,927 | 23,329 | 24,318 | 21,454 | 16,934 | 18,756 | 17,719 | 13,757 |
| Cost of Revenue (USD Million) | 20,185 | 20,922 | 17,605 | 20,729 | 19,172 | 20,394 | 18,818 | 18,541 | 16,072 | 12,700 | 13,296 | 12,872 | 10,097 |
| Gross Profit (USD Million) | 4,997 | 4,578 | 3,696 | 4,438 | 4,178 | 4,533 | 4,511 | 5,777 | 5,382 | 4,234 | 5,460 | 4,847 | 3,660 |
| Operating Expenses (USD Million) | 2,225 | 2,351 | 2,525 | 2,374 | 2,414 | 2,134 | 1,847 | 1,842 | 1,694 | 1,628 | 1,857 | 2,234 | 1,605 |
| Operating Profit (USD Million) | 2,772 | 2,227 | 1,171 | 2,064 | 1,764 | 2,399 | 2,664 | 3,935 | 3,688 | 2,606 | 3,603 | 2,613 | 2,055 |
| Net Non-Operating Interest Income (USD Million) | 337 | 262 | 274 | 272 | 244 | 210 | 184 | 124 | 33 | -18 | -33 | -46 | -116 |
| Profit Before Tax (USD Million) | 2,784 | 1,887 | 1,553 | 2,191 | 2,045 | 2,937 | 2,800 | 3,983 | 3,636 | 2,474 | 3,626 | 2,635 | 1,882 |
| Tax (USD Million) | 601 | 393 | 409 | -5,752 | 167 | 323 | 261 | 276 | 305 | 205 | 346 | 292 | 223 |
| Net Income (USD Million) | 2,167 | 1,478 | 1,171 | 7,927 | 1,851 | 2,703 | 2,513 | 3,722 | 3,292 | 2,256 | 3,318 | 2,326 | 1,618 |
| Diluted Net Income (USD Million) | 2,167 | 1,478 | 1,171 | 7,927 | 1,851 | 2,703 | 2,513 | 3,722 | 3,292 | 2,256 | 3,318 | 2,335 | 1,618 |
| Basic EPS (USD) | 0.7 | 0.5 | 0.4 | 2.5 | 0.6 | 0.9 | 0.8 | 1.2 | 1.1 | 0.7 | 1.1 | 0.8 | 0.5 |
| Diluted EPS (USD) | 0.6 | 0.6 | 0.3 | 2.3 | 0.5 | 0.8 | 0.7 | 1.1 | 1.0 | 0.7 | 1.0 | 0.7 | 0.5 |
| Number of Shares (Million) | 3,198 | 3,191 | 3,186 | 3,183 | 3,176 | 3,171 | 3,166 | 3,160 | 3,146 | 3,111 | 3,102 | 3,039 | 2,994 |
| Normalized Income (USD Million) | 2,209.9 | 1,969.4 | 1,129 | 7,930 | 1,853 | 2,703 | 2,513 | 3,745.6 | 3,292 | 2,389.6 | 3,318 | 2,321 | 1,662.9 |
| Interest Income (USD Million) | 429 | 348 | 350 | 333 | 282 | 238 | 213 | 157 | 86 | 26 | 28 | 25 | 10 |
| Interest (USD Million) | 92 | 86 | 76 | 61 | 38 | 28 | 29 | 33 | 53 | 44 | 61 | 71 | 126 |
| Net Interest Income (USD Million) | 337 | 262 | 274 | 272 | 244 | 210 | 184 | 124 | 33 | -18 | -33 | -46 | -116 |
| EBIT (USD Million) | 2,876 | 1,973 | 1,629 | 2,252 | 2,083 | 2,965 | 2,829 | 4,016 | 3,689 | 2,518 | 3,687 | 2,706 | 2,008 |
| EBITDA (USD Million) | 4,224 | 3,251 | 2,875 | 3,484 | 3,318 | 4,119 | 3,875 | 5,005 | 4,645 | 3,440 | 4,567 | 3,554 | 2,769 |
| Reconciled Depreciation (USD Million) | 1,348 | 1,278 | 1,246 | 1,232 | 1,235 | 1,154 | 1,046 | 989 | 956 | 922 | 880 | 848 | 761 |
| Profit From Continuing Operations (USD Million) | 2,183 | 1,494 | 1,144 | 7,943 | 1,878 | 2,614 | 2,539 | 3,707 | 3,331 | 2,269 | 3,280 | 2,343 | 1,659 |
| Normalized EBITDA (USD Million) | 4,279 | 3,873 | 2,875 | 3,484 | 3,318 | 4,119 | 3,875 | 5,039 | 4,645 | 3,582 | 4,567 | 3,554 | 2,820 |
Note: All financials are in USD Million. Data reflects Tesla Inc.’s performance from Sep 2021 to Sep 2024.
Expert Prediction On the Future Of Tesla Inc.
At the end of September 2024, Tesla’s revenues were $25.18 billion. That’s an increase of 7.8 percentage increase from year to year. Tesla reported a net loss of $2.17 billion, which is an increase of 16.9 per cent YoY rise. The company’s total profit in Q3 of this year was $4.99 billion. Tesla remains the electric car market leader by capturing a 60 per cent U.S. EV market share. With its constant growth and development, the company’s future growth opportunities are substantial.
Is Tesla Stock to Good Buy? (Bull vs. Bear Case)
Bullish Case:
- Tesla leads the electric vehicle market thanks to their advanced technology.
- Tesla is a consistent source of increase in profit and revenue (Q3 2024: $25.18 billion revenue, $2.17 billion gain).
- Tesla has expanded production across the globe and has grown its market share.
- Tesla’s energy storage and solar business is increasing rapidly.
- Tesla’s mighty brand name and innovative products draw clients.
Bearish Case:
- Tesla’s stock price is high relative to its profits.
- Old-fashioned automakers and the modern EV businesses are now catching up.
- Legal concerns with self-driving technology and manufacturing could slow development.
- Production scaling without problems can be complex.
- Low interest rates may decrease the demand.
Conclusion
Tesla’s stock has a strong chance to grow, fueled by its position as a leader in electric cars, energy solutions, and development o,f. It is anticipated to remain steady from 2025 to 2026, at $150 and $350. Tesla’s expansion may result in significant growth in the coming decade, reaching as high as $500 to $700 in 2030. In the long term, predictions indicate a substantial increase that could reach $1,500 to $2,000 in 2040 and between $3,000 and $4,000 by 2050. Tesla’s innovative technology and focus on sustainability are strong reasons to believe in bullish forecasts.
